Visual processing
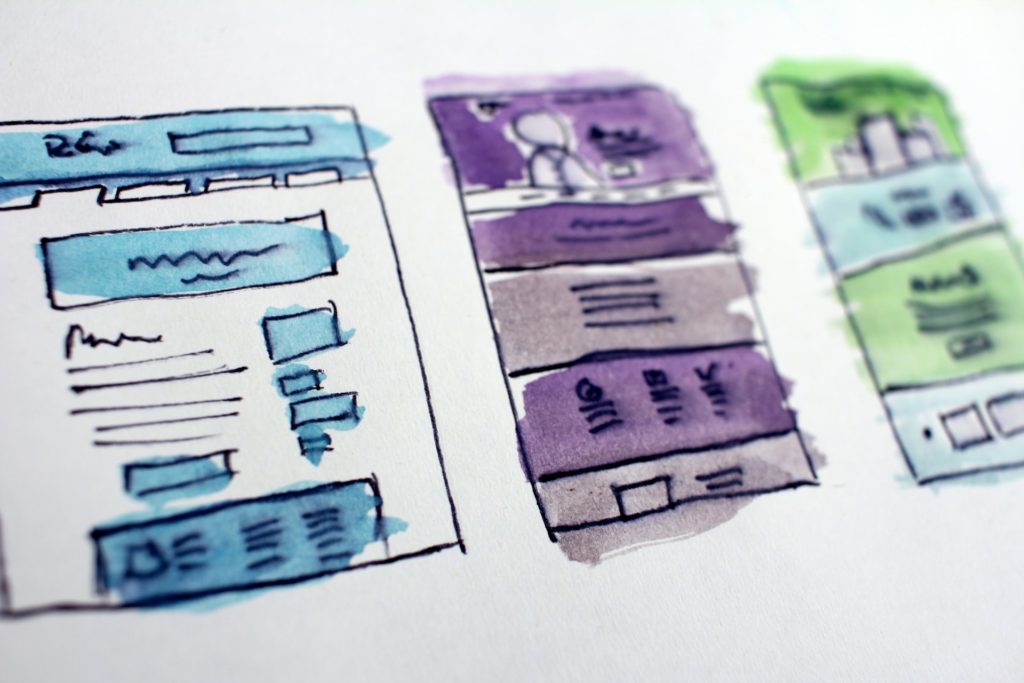
According to research, the brain processes visual content at a rate 60,000 times quicker than in written form. That is a startling idea and perhaps one that needs to be put into an infographic for us to fully comprehend. If you want to get an idea across to your audience and boost your brand awareness, you really can’t afford to overlook the power of visual elements.
Condense ideas into a digestible format
Looking at pages and pages of text can present a difficult dilemma to marketers who have to find a way to get it across to readers in a digestible way. Even well-research and informative copy can be difficult to sell to your audience, but an infographic could be the answer. Infographics take up less space on your website and do not put people off with a wall of text. When they are well-designed, they set things out logically so they can be consumed in more bite-sized pieces, making complex ideas seem simple.
Visually appealing
The success of your infographic depends wholly on the visuals, so it’s important to hire a graphic designer with a proven track record. They should present the information in a clean way that draws your audience in and leaves them feeling they have gained value from scrutinising your asset. Good designers will select a style that chimes with your brand and appeals to your potential customers.
Highly shareable
Good looking infographics presented in an accessible format have a better chance of being shared via social media or other digital channels, making them highly reusable content. This means they are likely to work harder for your brand, spreading your name and message far and wide. If brand awareness is one of your goals, this should not be overestimated and an infographic that contains the colours and typefaces seen in your logo can go a long way to making your business a household name.
Great for SEO
Inherently shareable content is good news for your site’s search engine optimisation (SEO) as it provides you with those valuable backlinks. Every time someone shares your infographic, it ups the amount of traffic going to your website, which in turn drives it up the search engine results pages (SERPS).
Track the success of your infographics
Tracking the performance of your content is always important, as it not only lets you know what return on investment (ROI) you’re achieving, but also how you might tweak digital campaigns in the future. Infographics are particularly easy to track and analyse, with views, shares, downloads and traffic all good metrics to measure.


